Exosome RNA Exosome RNA Research & Industry News

Extracellular vesicles, often called exosomes when referring to certain small subtypes, are tiny membrane bound particles released by cells. They carry proteins, lipids, and nucleic acids, allowing cells to communicate with one another. Because they circulate in biofluids such as blood, they are also being explored as biomarkers for cancer and other diseases.
Despite their promise, accurately defining what is truly inside small extracellular vesicles has been a major challenge. Preparations of these vesicles often contain contaminants, including protein aggregates and fragments of cellular debris. This makes it difficult to distinguish genuine vesicle cargo from co isolated material.
Researchers from the Spanish National Cancer Research Centre applied an approach called protein correlation profiling along density gradients. This technique separates particles based on their physical properties and then analyzes how proteins distribute across fractions. Using this strategy, the researchers examined more than 9,000 proteins from human cancer cell lines and biofluids.
Systematic analysis of sEV, NV-dual and NV proteins in 15 human cancer cell lines
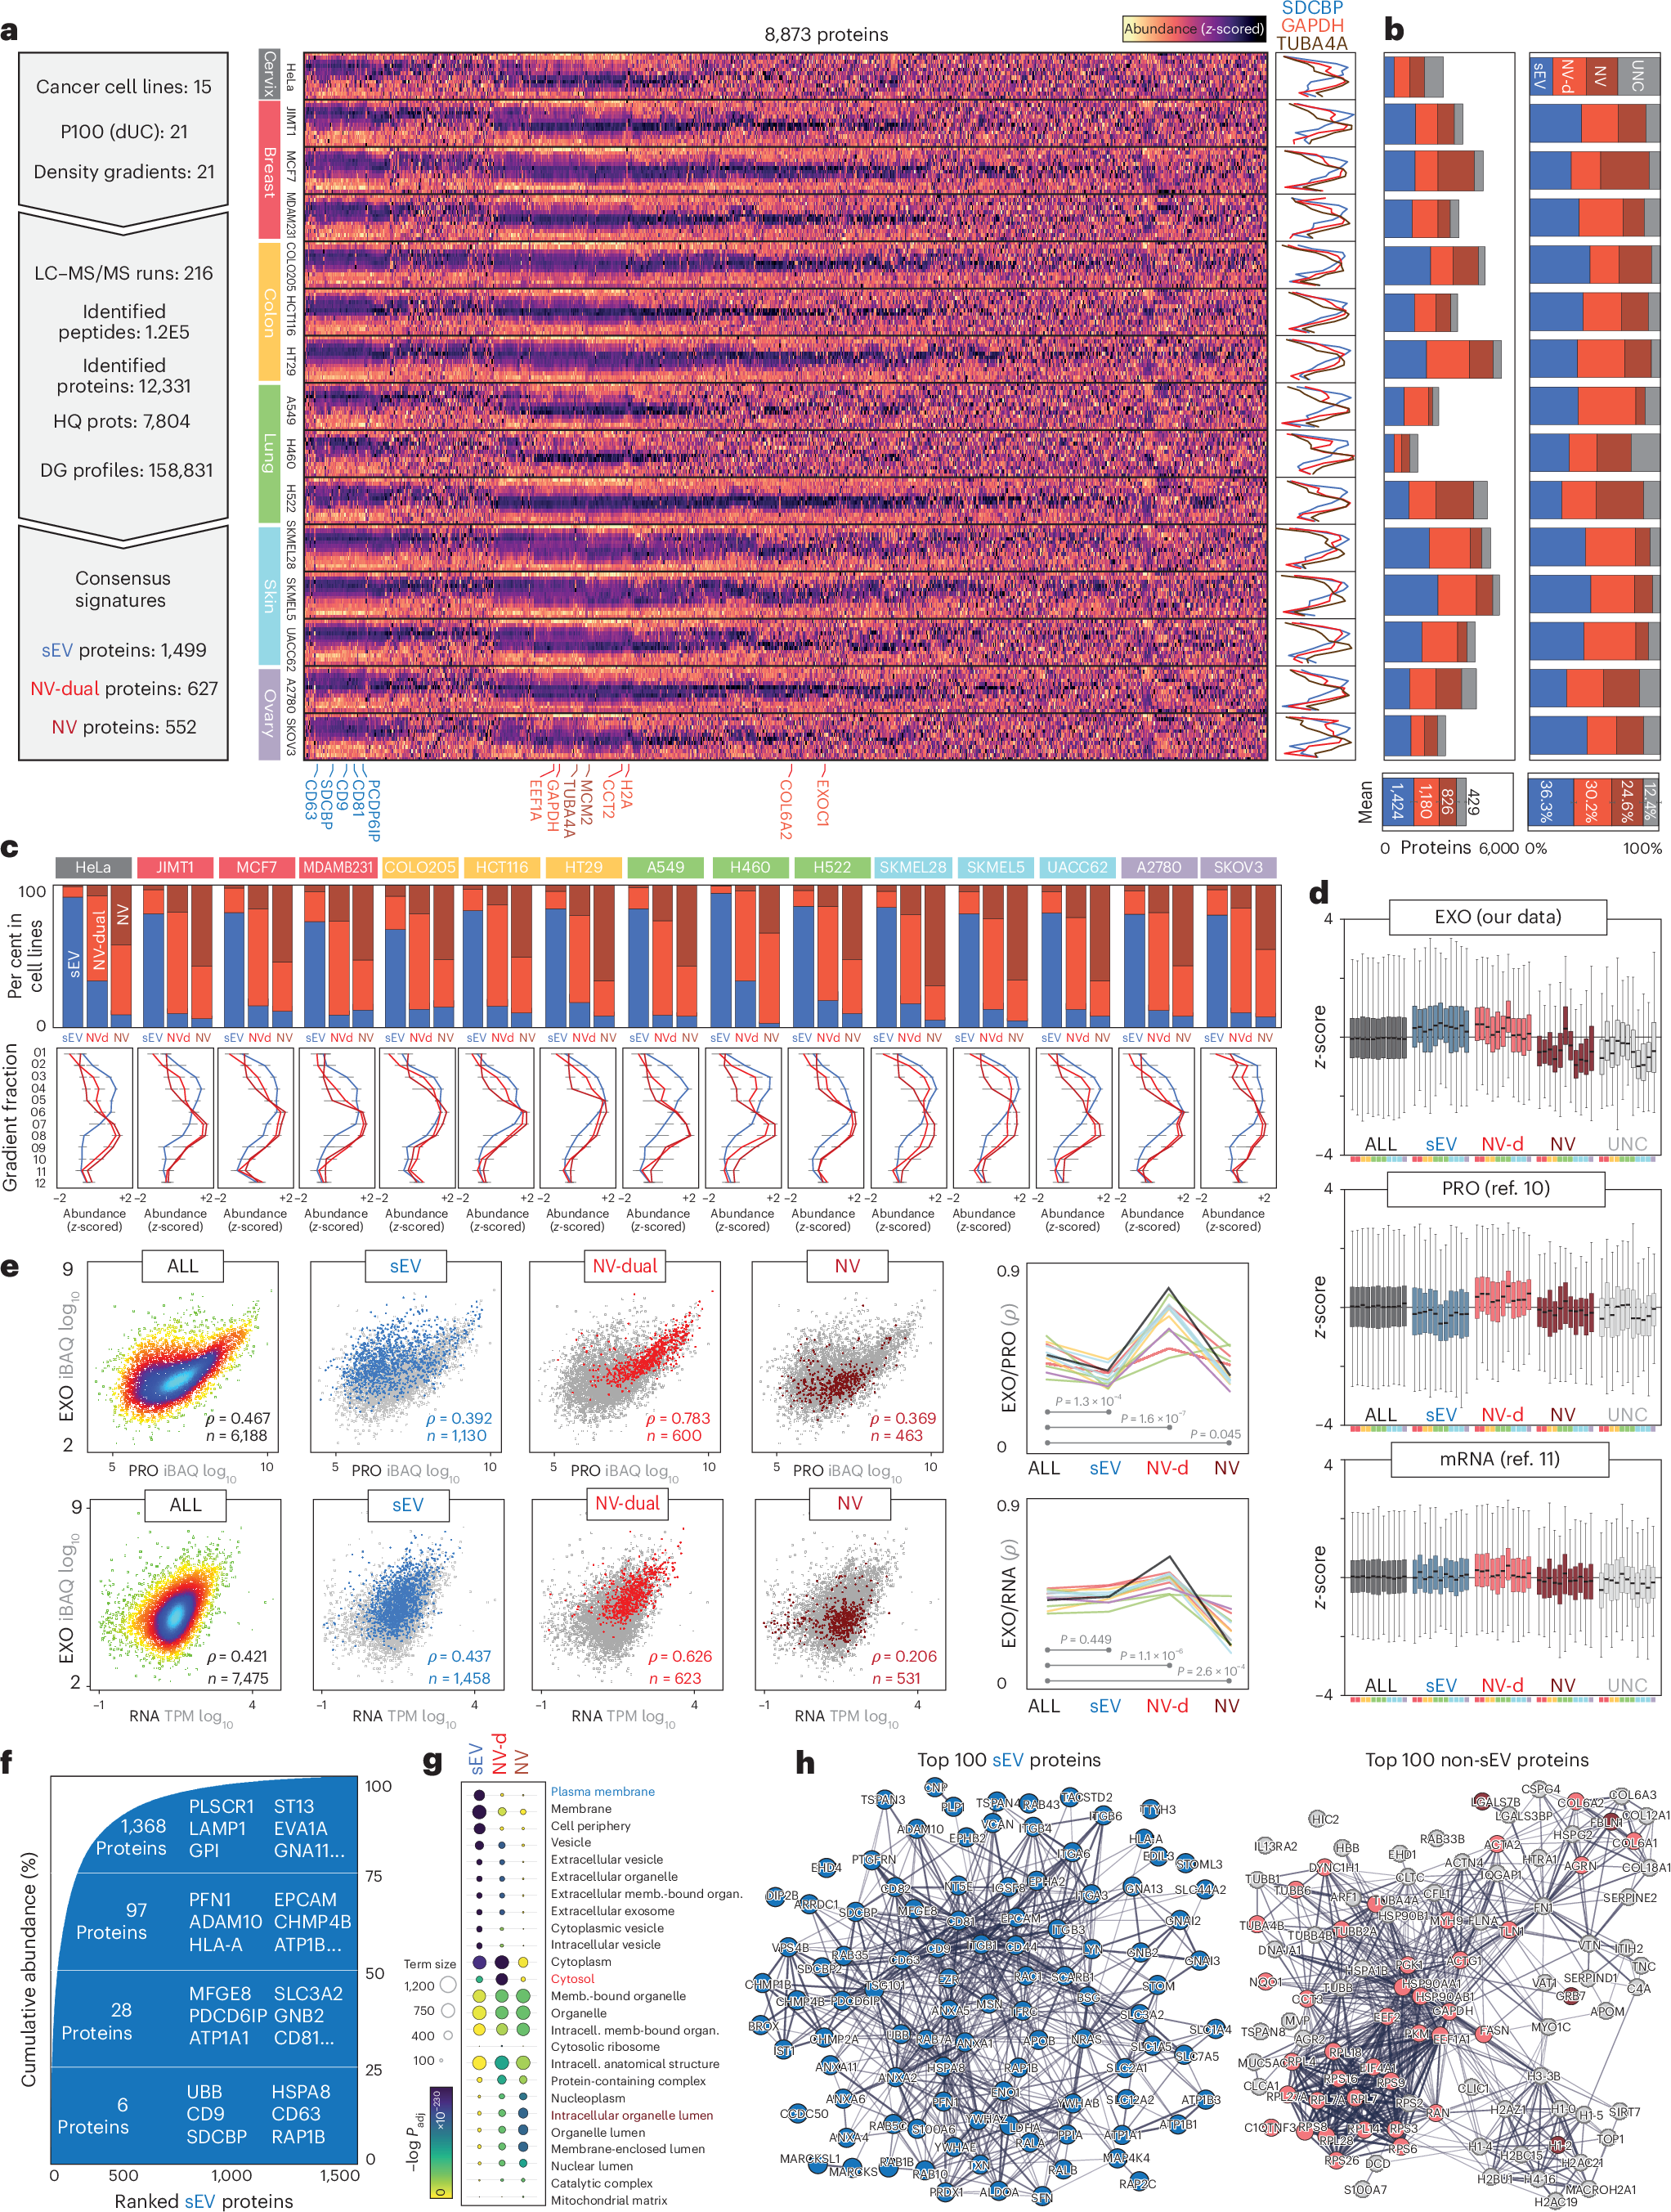
a, Crude sEVs from 15 human cancer cell lines were analysed by DG–PCP, and the resulting elution profiles for all 8,873 identified proteins are shown in the heat map. The summary metrics for all datasets (including replicates) (left) and representative elution profiles of SDCBP (sEV), GAPDH (NV-dual) and TUBA4A (NV) across all 15 cell lines (right) are shown. b, Protein counts and relative proportions of proteins classified as sEV, NV-dual, NV or UNC in each cell line. The mean protein counts and relative proportions (percentage of total identifications), averaged across n = 15 cell lines, are indicated at the bottom with error bars representing the s.e.m. c, Top: for proteins classified as sEV, NV-dual or NV in one cell line, the proportion of proteins classified as sEV, NV-dual and NV in the remaining cell lines is shown as a bar chart. Bottom: the centroid profiles of sEV, NV-dual and NC proteins identified in each cell line are shown. The data (n = number of proteins in cluster) are presented as median values, with error bars representing the interquartile range. d, Box plots showing the abundance levels (z-score) of sEV, NV-dual, NV and UNC proteins identified in our data (EXO) compared to their intracellular protein levels (PRO)10 and mRNA expression levels (RNA)11 across n = 15 independent cell lines. The sample size (n) for each box plot represents the number of distinct proteins or transcripts quantified in that specific category and cell line. Box plot elements: centre lines indicate medians; box limits represent the 25th and 75th percentiles; whiskers extend to 1.5× the interquartile range. e, Correlations between our data (EXO) and PRO10 (top) or RNA11 (bottom) data. Average values of all cell lines are used. Proteins classified as sEV, NV-dual and NV are colour-coded. Spearman correlation coefficients (ρ) for each cell line are displayed as line charts on the right. A statistical assessment was done using a two-sided paired Student’s t-test. f, The 1,499 proteins consistently classified as sEVs were ranked by abundance. The number of proteins constituting each quartile of fractional mass is indicated with examples of specific proteins. g, GO cellular component terms enriched in sEV (1,499 proteins), NV-dual (627 proteins) and NV (552 proteins) protein classes. Gene‑set over‑representation was assessed with g:Profiler using a one‑sided cumulative hypergeometric test (Fisher’s exact test) for each term. P values were adjusted for multiple testing using the g:SCS procedure (set counts and sizes) implemented in g:Profiler. h, Protein interaction networks constructed via the STRING database using the top 100 most abundant sEV proteins (left) and the top 100 most abundant non-sEV proteins (right). In the non-sEV network, proteins belonging to the consensus NV-dual and NV signatures are coloured red and brown, respectively. Proteins shown in grey represent abundant non-sEV components that did not meet the consensus criteria for either category. HQ, high quality; TPM, transcripts per million.
Their findings provide a clearer picture of what truly belongs to small extracellular vesicles. The results suggest that these vesicles primarily incorporate plasma membrane proteins through selective cargo loading mechanisms. In contrast, many abundant cytosolic proteins frequently detected in vesicle preparations are not actually enclosed inside vesicles. Instead, they appear to be externally associated, likely originating from cellular debris or aggregates that co purify during isolation.
This distinction is important. If researchers assume that all detected proteins are part of extracellular vesicles, they may misinterpret biological functions or biomarker potential. By systematically separating vesicle associated proteins from non vesicular components, the study offers a refined reference proteome for small extracellular vesicles.
These insights improve our understanding of vesicle biogenesis and cargo selection, and they help establish clearer standards for future extracellular vesicle and exosome research. For scientists working on cancer diagnostics or intercellular signaling, having a reliable map of vesicle protein composition is essential for moving from discovery to clinical application.